|
Investment Programs: Classic |
|
|
|
|
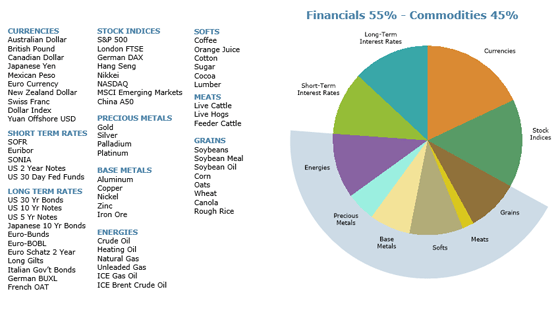
Overview EMC's Classic Program seeks to provide long-term positive returns with low correlation to equity and hedge fund portfolios. EMC employs multiple quantitative, systematic trading models across a broad range of liquid global financial and commodity markets. Sectors traded include stock indices, currencies, financial futures, precious and base metals, energies, agricultural and soft commodities. The active trading models are designed to capture profit opportunities in bull and bear markets. PAST PERFORMANCE IS NOT NECESSARILY INDICATIVE OF FUTURE RESULTS. THE RISK OF LOSS IN TRADING COMMODITIES CAN BE SUBSTANTIAL. YOU SHOULD CAREFULLY CONSIDER WHETHER SUCH TRADING IS SUITABLE FOR YOU IN LIGHT OF YOUR FINANCIAL CONDITION. FUTURES TRADING INVOLVES A HIGH DEGREE OF RISK, INLCUDING LIQUIDITY RISKS, NO SECONDARY MARKET EXISTS, RESTRICTIONS ON REDEMPTIONS AND THE RISK OF FOREIGN SECURITIES. Tables and charts prepared by EMC Capital Advisors. Performance represents all accounts traded in the EMC Classic Program, net of fees. The EMC Classic Program does not reflect the performance of any one account, but rather a combination of the historical performance of multiple accounts and portfolios with varied fee structures. Therefore, an individual account and a particular trading portfolio may have realized more or less favorable results than the composite indicates. Data derived from Backstop Barclay Group. Prior to October 1, 2013, accounts were managed by EMC Capital Management, Inc., the predecessor of EMC Capital Advisors, LLC. 
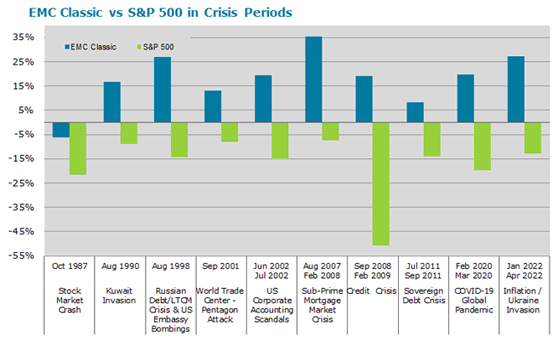
EMC has traded global markets for 35 years, successfully navigating some of the worst financial market periods in modern history. The systematic strategies employed by EMC allow the Classic Program to profit during market crises by taking long and short positions in a wide variety of financial and commodity futures. By profiting during the worst periods for traditional asset classes, EMC's Classic Program adds true diversification to an investment portfolio.  EMC Classic Program Portfolio  Index Glossary Any available index returns are hypothetical and do not represent the results of actual trading of Investable Products, and as such, do not represent actual past performance and are not indicative of any specific investment. Index returns do not reflect any fees, expenses or sales charges. The Content (including any of the output derived from any analytic tools or models) is not intended to predict actual results, which may differ substantially from those reflected. It is not possible to invest directly in a financial index. Exposure represented by an index is available through instruments based on that index. Start date range for EMC Classic VAMI chart above based on Soc Gen CTA Index inception date January 2000. BTOP50 CTA Index: The BTOP50 Index seeks to replicate the overall composition of the managed futures industry with regard to trading style and overall market exposure. The BTOP50 employs a top-down approach in selecting its constituents. The largest investable trading advisor programs, as measured by assets under management, are selected for inclusion in the BTOP50. In each calendar year the selected trading advisors represent, in aggregate, no less than 50% of the investable assets of the Barclay CTA Universe. To be included in the BTOP50, the following criteria must be met: the program must be open for investment, the manager must be willing to provide us daily returns, the program must have at least two years of trading activity, and the program's advisor must have at least three years of operating history. The BTOP50's portfolio will be equally weighted among the selected programs at the beginning of each calendar year and will be rebalanced annually. Soc Gen CTA Index: The SG CTA Index provides the market with a reliable daily performance benchmark of major commodity trading advisors (CTAs). The SG CTA Index calculates the daily rate of return for a pool of CTAs selected from the larger managers that are open to new investment. Selection of the pool of qualified CTAs used in construction of the Index will be conducted annually, with re-balancing on January 1st of each year. A committee of industry professionals has been established to monitor the methodology of the index on a regular basis. The SG CTA Index will allow market participants and institutional investors to: Measure aggregate CTA performance on a day-to-day basis; Track the performance of a CTA (or a pool of CTAs) against the market; and Assess the performance of Managed Futures Funds against an index with the same accuracy as is already possible for other asset classes. S&P 500 Total Return Index: A weighted index consisting of the 500 stocks in the S&P 500 Index, which are chosen by Standard & Poor's based on industry representation, liquidity, and stability. The S&P 500 uses a market-cap weighting method that gives a higher percentage allocation to companies with the largest market capitalizations. The S&P is a float-weighted index, which means the market caps of its components are adjusted by the number of tradable shares. The Total Return calculation includes the price plus the gross cash dividend return. You can't invest directly in the S&P 500 because it's an index but you can invest in one of the many funds that use it as a benchmark and track its composition and performance. |